
|
DisplayRX - show data from remote sensors
It shows, alternating on a large display, multiple data coming from HTTP MQTT WiFi or RF sources
(versions: I4 Std, I4 Maxii, I8, E4) available [get it now - below]
|


|
We have also ControlHUB...
If in addition to seeing data you are interested in acting in relation to them, we also have ControlHUB (RS232, RS485 Modbus, WiFi HTTP and MQTT; more info here ...), it works as basic as DisplayRX and in the DX / DY version it also has the same display, but once it has received data / variables from external sensors it can perform actions (actions chosen by the user: send HTTP, MQTT, Serial, ModBus commands; for DY / CY versions also activate internal relays) in relation to conditions ( chosen by the user); moreover it can read even more things, everything that DisplayRX reads / receives, more RS232 or ModBus devices connected on the bus and it can also do Web queries (which means reading data from the Internet and also means being able to read physical devices that make data available via their virtual website). In short, it is a rather sophisticated and complete control system, which can use data to perform actions (local and remote physical, and / or Web / MQTT data transmission).
|
|
Quick manual for DisplayRX
A. TO CONNECT AND SET THE TIME / DATE
1) connect to WiFi wfeasy.com - on some smart phones it may be necessary to confirm the connection ("this connection has no Internet, etc. etc.") and/or disconnect the data connection because in some cases it penalizes performance; after the first configuration you can also connect via your WiFi see point D.
2) connect with the browser (Safari, Chrome, Firefox, etc.) to the wfeasy.com site - here is the QR:

3) a login page is shown, asking for a password, the standard one is pippo - enter it and click OK. Then the main page is shown:
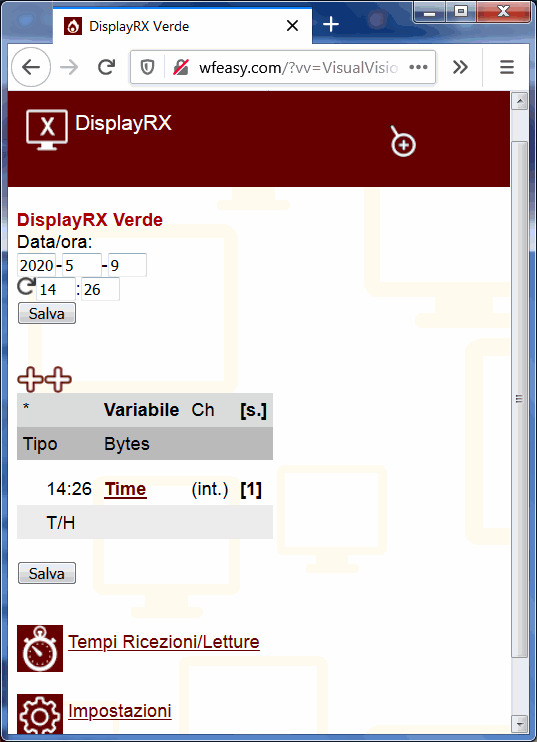
By clicking "Save" at the top you can set the current time as the time / date.
Just below, DisplayRX shows the things that are in rotation on the display. By default it will show the time.
B. ADD THINGS TO SHOW, EG. TEMPERATURE FROM TXTEMP
1) connect etc. as in point A
2) above the list of displayed variables (at the beginning only the time or "Time") there are ++ - clicking them, you can add new variables / received data to show.
In the new variables creation page, the first thing to choose is the channel to receive, which will be the channel on which the TXdata / TXtemp / TXsoil transmitter operates - it is the first thing to choose because it affects the subsequent settings.
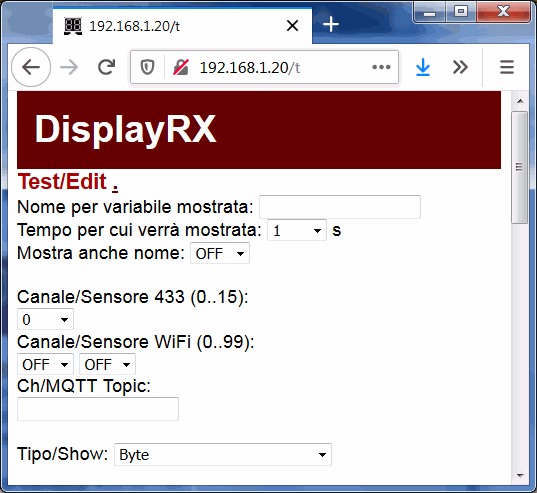
To have something to show as an example in this manual, we took and activated a TXtemp on Channel 433 number 1, and put it out of the window.
Preparing to receive it and to show the temperature it transmits, we then name the variable Tfin, we choose the "433" Channel number 1; and in Type/Show we tell DisplayRX that on that channel we are going to receive a TXtemp (the TXtemp is already in the preselections). In short, we will have this:
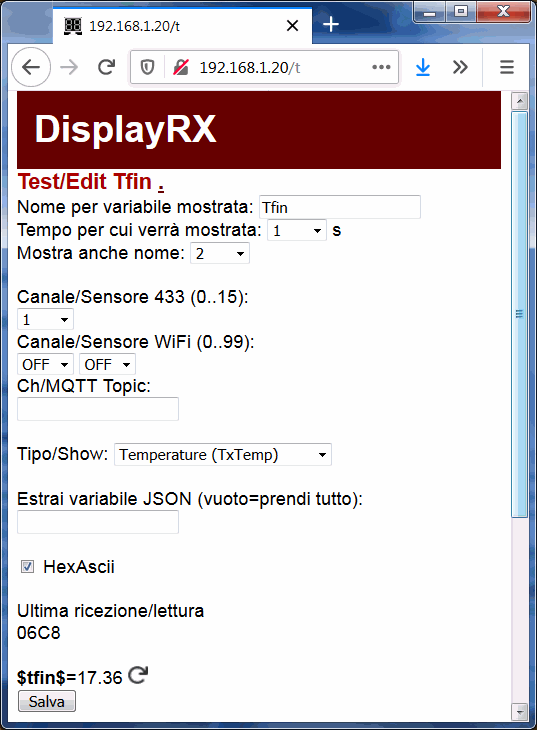
As you see if the data is transmitted by WiFi with JSON, a variable can be extrated from the JSON by name.
You can even create a custom sensor that sends data to DisplayRX with HTTP; and you can test this even without the sensor as you can enter HTTP commands with a browser (specifications).
And/or for the RF433 VisualVision standard, bytes can be extracted from a HexAscii message.
If you want, you can specify a time in "also show name" (eg 2 seconds; show "Tfin" before displaying the temperature; it is very useful when there are many things that alternate on the display). If you have done all this now, because you have bought a TXtemp and a DisplayRX and are trying, you will see that by making this choice some other settings on the page disappear (because they are irrelevant).
Once all the settings have been decided, click "Save" and the external temperature is immediately set in rotation, together with the time that was already pre-set. If the TXtemp, while you were doing this, had already made some transmissions, pressing "Save" you will immediately see the temperature (resulting from the last transmission), presented as variable $tfin$ (this standard for naming variables takes on meaning in ControlHUB). Otherwise wait, or manually turn on the TXtemp and use the "Test TX" button which is in the TXtemp HomePage.
When we took the "picture" of the screen we had already turned on and configured a TXtemp on channel 1 so that we can already see the received temperature.
C. ADD THINGS TO SHOW, EG. A DATA EXTRACTED FROM A MODBUS RESPONSE SENT TO US FROM TXDATA
1) connect etc. as in point A
2) To do the tests, we set a TXdata to transmit on WiFi Channel 2 and we connected with two wires A and B to a small meter in ModBus standard which can measure Volt Amps, Watts, Hertz etc. We also took care to set as WiFi in TXData the DisplayRX WiFi we are using for the test.
Then we clicked, on the TXdata, the "Test TX" button. At this point, on DisplayRX, before we start adding a new variable that draws from WiFi channel number 2, we can already visit the "Reception / Reading Times" menu out of curiosity, we will see this page:
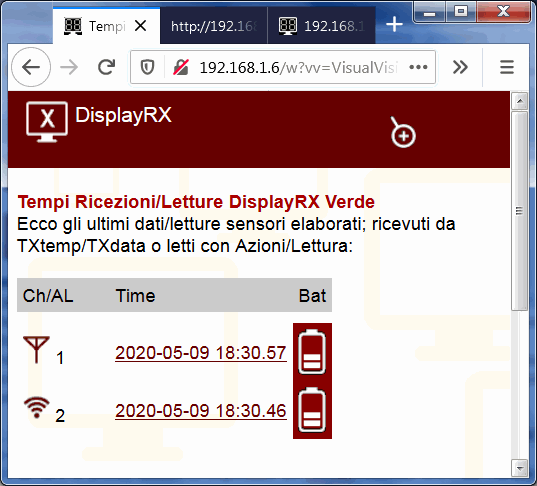
and everything is OK: we can already see that together with the temperature we are continuing to receive from the TXtemp put on RF Channel number 1 and continuously arriving, there are also other data arriving from WiFi Channel number 2 (this feature is a useful test / monitor to check that everything is working).
Now let's go back to the Homepage, click the ++, and let's get ready to add in rotation on DisplayRX a variable extracted from the data transmitted by TXdata. We would like to read for example the measured Volts. We immediately choose the WiFi channel number 2, give a name, etc.
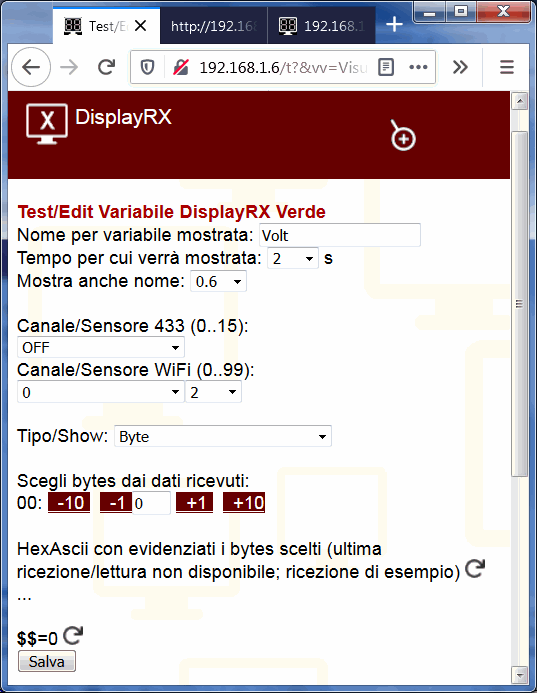
At this point, by clicking Save (or the Reload circular arrows), DisplayRX will read the last transmission it received on WiFi Channel 2 and display it.
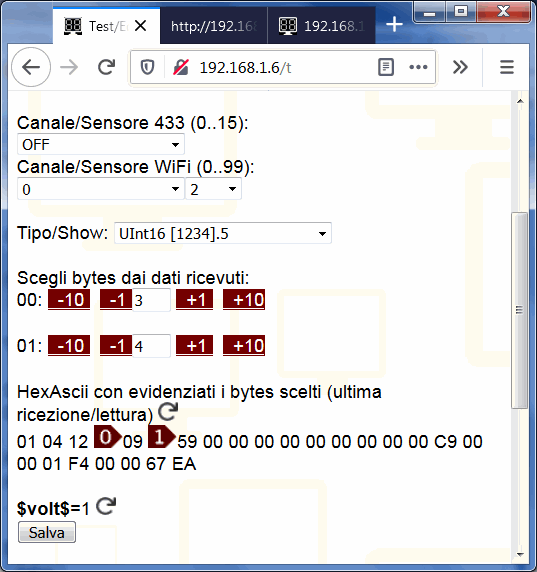
In practically all ModBus responses, the data are transmitted as Bytes, Integers or even Floats. In our case, from the meter manual, we know that the voltage in Volts is stored multiplied by 10 and as an integer (2 bytes), and in the ModBus query we have done (which asks the meter for all the data) this number ends up in the 3rd and 4th byte. As you can see in the figure above, DisplayRX allows you to see the response, to choose the type of data we need, and to go and draw the corresponding bytes.
If now, by pressing the Reload key, a value appears on about 2200-2400 (220-240V) it means that we have guessed the correct bytes. Let's see ...
Hum ... no, comes 24302, easily we are reversing HSB and LSB .... let's try reversing 4 and 3 ...
Here it is:
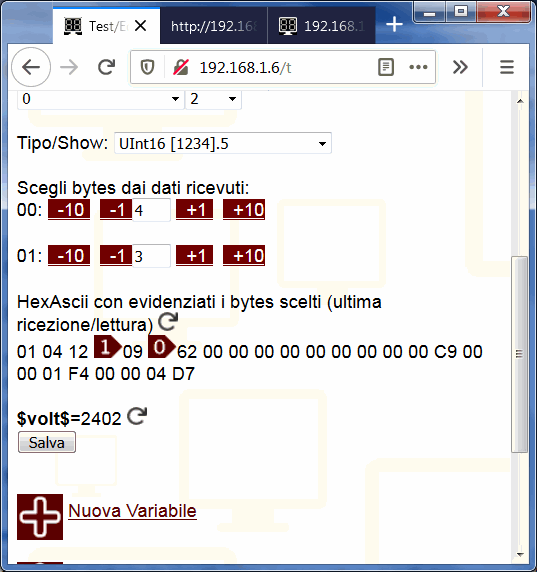
obviously knowing more or less what data must arrive helps in configuring, as indeed with any ModBus instrument.
Note that with the chosen Type, 240 and not 2402 will be shown on the display (the symbolism [1234]5 means that if the number is 12345 the part 1234 is shown).
Now we can press Save and also the Volts measurement will cycle together on display with that of the temperature.
It is possible to show other RF 433 or WiFi channels.
It is also possible to add other variables that "take" the other data present in the transmission that arrives at Channel 2 WiFi; as we have set it up now TXdata requires everything and also transmits other things besides the voltage in Volts, that is Watts, mains frequency, current in Amperes, which would perhaps be even more significant - since while we write the voltage is changing maximum in 238 239 240 ... after all that is ... but we do not do it here for the sake of brevity.
Instead of directly connecting the TXdata to the DisplayRX WiFi, if you already have a router and a WiFi in place, you can connect everything to that general WiFi, fix the DisplayRX IP in the router, and then tell TXdata this IP as the IP to which to transmit.
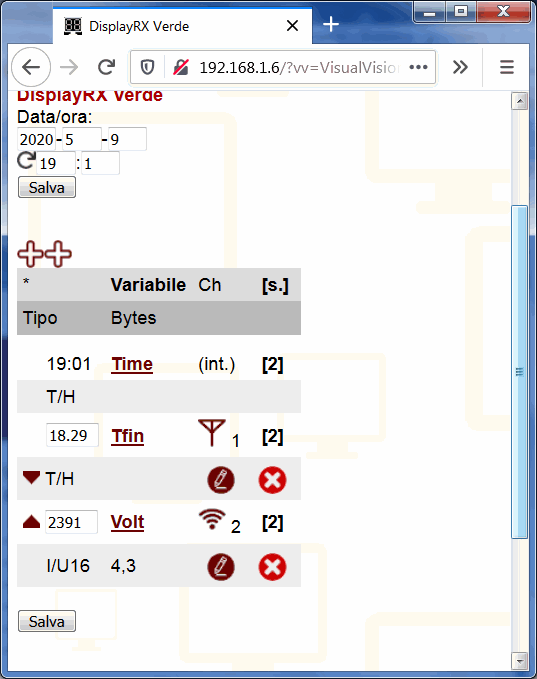
Last but not least, remember that on the Homepage you can delete or modify all the variables in rotation:
D. SHOWING DATA EXTRACTED FROM AN MQTT TOPIC
1) as in point B or C
2) write the name of the Topic to listen to in Ch / MQTT Topic
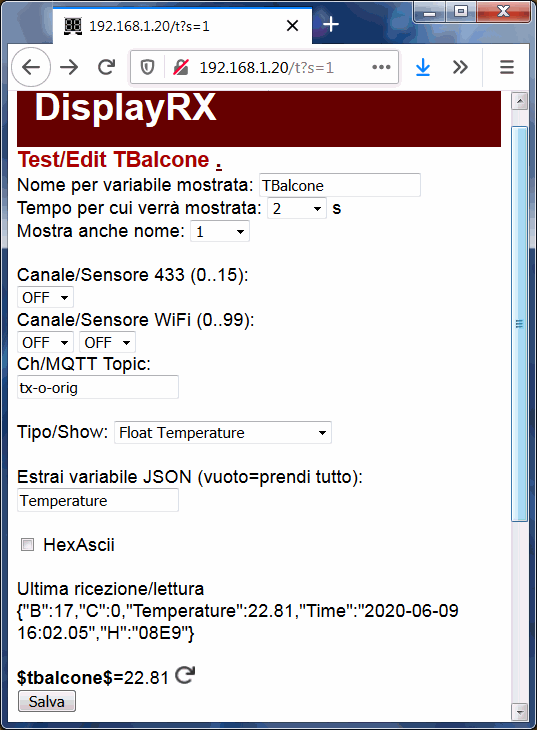
3) eventually you can make sure that the topic is transmitted and reload the page (so that it will display the complete MQTT message as "last reception / read"), or if you already know the format of the message transmitted by the topic you can do it immediately. In this example we want to take the temperature from a sensor which transmits MQTT messages, and we know that it transmits messages in JSON format (which would be the one with braces and quotes), which transmits the temperature as "Temperature" and so we tell it to take Temperature, by simply writing Temperature. He will be able to look for it inside the braces and remove any quotes (but DisplayRX is very versatile and would take the data in a lot of other cases too).
Since then we know that the data that arrives is a temperature, we have chosen as type "Float temperature" so that the number 22.81 you see in the image is correctly extracted from the first MQTT message that arrived when we did the test to write this manual: in other words, if the device you want to receive data from is active, you can immediately see on the screen if the value you want to extract is extracted correctly ... it's very convenient !!, it will be shown on DisplayRX as 22.8°
With °F it is just the same.
E. CHANGE THE PASSWORD AND DEFINE THE VARIOUS OPTIONS
1) connect etc. as in point A (at wfeasy.com/wfeasy.com)
2) at the bottom of the main page, choose the link "Settings"
3) the operating parameters can be defined under the language:

As for the parameters:
- "Name" is the name given to the device (to distinguish it in case you have several);
- "Password" is the access password (in the image the standard ones; change it);
- "Brightness" the maximum brightness chosen
- "Synchronize with atomic clock" activates the synchronization of the clock with a group of atomic clocks - using WiFi connection to reach them (WiFi connection must be set up).
E. WiFi SETTINGS (CONNECT TO HOME / OFFICE / LAB WiFi) AND MQTT, MQTT INTERNAL BROKER
1) connect etc. as in point A at wfeasy.com/wfeasy.com
2) go to the WiFi / MQTT menu
F. ACCESS DISPLAYRX WITH HOME / OFFICE / LABORATORY / ETC WiFi.
1) connected etc. as in point A at wfeasy.com/wfeasy.com
2) make sure that you have entered the parameters of your WiFi as in point E, and that you have memorized / connected them
3) if it is connected to your WiFi, at the bottom of the window it will indicate the name of the WiFi and the IP it assumes, eg. 192.168.1.14
4) with the PC / Mac / phone or whatever, connect to the same WiFi
5) click the link if the page is still there, or type the number on the browser bar, all attached with all the dots that separate it, without spaces, for example 192.168.1.14 or http://192.168.1.14
In almost all routers there is a menu (eg Utility DHCP) where you can decide to permanently assign a particular IP address to DisplayRX; which can be very useful because now also the TXdata / TXtemp / TXsoil can be connected to the home / office / lab WiFi and can "talk" to the DisplayRX by going through the router and using this IP. If the internal MQTT broker is then activated and used via WiFi, it is essential to fix the IP because it will be inserted in all MQTT devices that use the broker.
|